
Product Design · Full-Stack Dev · 2026
Data-Driven TCG tracker built for collector confidence
Product Design · Full-Stack Dev · 2026
Designing a data-driven TCG market tracker
so hobbyist collectors can buy with confidence
S2
The Problem
Trackers already exist. They just bury the signal.
Sites like TCGplayer and PriceCharting have price data — but they're built for searching individual cards, not for seeing what's moving. In the TCG world, knowing your favourite card is trending down and that now's a good time to buy is useless if you find out too late. By the time most collectors notice, the window's already closed.
The sell side has the same problem. Collectors hold cards hoping the value keeps climbing — not realizing the market already peaked and dropped. The goal wasn't to rebuild what exists. It was to strip out the extra layers and surface trends the moment they happen.
Role
Solo Designer & Developer
Constraint
$0 budget — free tiers only
Stack
Next.js 16 · Tailwind v4 · Neon Postgres
S3
Field Discovery
The research happened on the trade floor, not in a survey.
Before writing a line of code, I spent time at six regional TCG card shows across the Lower Mainland — talking to collectors, sellers, and graders mid-deal. One question anchored every conversation.
What is a feature you wish TCG apps and websites had that would give you more confidence in this hobby? Three answers came up again and again, almost word for word, across every show.
Each one became a feature. The three insight cards below trace the line from what collectors said to what got built.
Key Research Question
"What is a feature you wish TCG apps and websites had that would give you more confidence in this hobby?"
Fear of Missing the Moment
"I regret not buying — or selling — that card earlier."
Collectors knew prices were moving. They found out too late.
Price Context, Not Just Price
"What's actually a good price? Low, mid, high — I need more than one number."
Market price alone can't tell you whether you're getting a deal or being overcharged.
Stock-Style Watchlists
"I want alerts. Like the stock market — set a target and get notified when it hits."
Collectors wanted passive monitoring. Not daily manual checks.
Insight A · Missed Windows
Collectors knew prices were moving — they just found out after the fact. By the time they opened the app and noticed the delta, the moment to buy or sell had already passed. "I regret not acting sooner" came up at every show.
Design Decision
Built a nightly trend engine that computes 7-day and 30-day price deltas across all 40,430 cards and tags each by band: Skyrocketing, Trending Up, Stable, Trending Down, Crashing. The homepage leads with the week's biggest movers — so the signal reaches you before the window closes.
Insight B · Opaque Pricing
"Market price" is a single number that answers none of the questions collectors actually have. Whether $14.50 is a steal or a rip-off depends on context — the spread, the floor, what sellers are actually asking. That context didn't exist anywhere.
Design Decision
Designed a Market Depth panel on every card detail page: an order-book-style ladder showing High, Market, Mid, and Low price rungs. Bar widths scale relative to the ceiling. The Market rung gets a rotated-diamond marker. The spread is readable at a glance — no math required.
Insight C · Manual Monitoring
Collectors who wanted to buy at the right price had to check manually, every day. Watching a card meant remembering to look it up. "I missed it" was the most common thing I heard — not because the tool didn't have the data, but because nobody had time to babysit it.
Design Decision
Built a price alert engine. Set a target price on any card, get notified the moment the market hits it. A single atomic SQL CTE detects all triggered targets, fires notifications, and flips the flag in one pass — idempotent, no polling, no duplicate pings. The alert re-arms only when you explicitly re-watch the card.
S4
User Personas
Two collectors at opposite ends of the same confidence gap.
The same tool has to work for someone who's run a table for years — and someone walking up to their first one. One knows the cards cold and needs speed; the other knows nothing yet and needs a baseline. Designing for both kept the product honest.
Marcus
Seasoned Collector · Weekend Vendor
"I know what the cards are worth — I just can't track every set the moment it moves."
Goals
- →
Catch the week's biggest movers before he prices his table
- →
Time buys and sells around drops and market swings
- →
Watch dozens of cards at once without checking each by hand
Frustrations
- ✕
Prices shift between shows — finds out a card spiked after he's already sold it
- ✕
Reprices inventory from memory; no fast read on the current spread
- ✕
Keeping up with every set, drop, and news cycle is a second job
Priya
New to the Hobby · First Card Show
"I don't want to lowball a seller and look rude — but I don't want to overpay either."
Goals
- →
Learn what a fair price actually is before walking up to a table
- →
Tell a real deal from a markup without knowing every set
- →
Feel confident enough to negotiate instead of just nodding along
Frustrations
- ✕
No reference point for what a card should cost — every price feels like a guess
- ✕
Intimidated to haggle; scared of insulting a vendor with a low offer
- ✕
Can't tell sets, rarities, or printings apart yet — it all blurs together
How One Product Serves Both
Need
Know what's moving
Design Response
Weekly Card Chart — editorial front page surfacing the week's biggest movers
Both — Marcus times his table, Priya learns what's hot
Need
Price context, not just a number
Design Response
Market Depth panel — spread ladder showing High, Market, Mid, and Low on every card
Priya especially — a baseline so a fair offer isn't a guess
Need
Passive price monitoring
Design Response
Watchlist + nightly alert engine — notified the moment market hits the target price
Marcus especially — watch dozens of cards, zero manual checks
S5
User Flows
One product, two paths to the same confident decision.
Each persona reaches the same outcome — acting with confidence instead of guessing — by a different route through the same screens. Marcus optimizes for timing; Priya for a baseline. Tracing both flows kept the IA honest: every screen had to serve a job for someone.
Weekly Card Chart
Scans the week's biggest movers the moment he opens the app
Tap a Skyrocketing card
Drills into a card tagged Trending Up for the full read
Read Market Depth
Checks the High / Market / Mid / Low spread — is now a fair entry?
Buy now, or wait?
Climbing fast, but he's holding out for a better number
Set a watch target
Names his price and closes the app — no daily checking
Alert fires overnight
The nightly engine pings him the moment market ≤ target
Buys at his price
Acts inside the window — instead of finding out too late
Spots a card at a table
Likes it — but has no idea what it's actually worth
Search The Board
Filters by game and set to find the exact card
Open Card Detail
Lands on the deep-dive for that exact printing
Read the spread ladder
Sees Low / Mid / Market / High — context, not one scary number
Gets a fair-price baseline
Now knows the realistic range before she says a word
Makes a confident offer
From data — not too low to offend, not too high to overpay
S6
Design Language
"Pokédex Bright" — editorial, not clinical.
Colour Tokens
--poke
Pokémon red
--onepiece
One Piece blue · primary
--rift
Riftbound gold
--gain
Price up
--loss
Price down
--base
Page surface
--ink
Body text
One token set, two themes — every utility reads var(--color-*); the .darkclass swaps the values. The three game-brand hues — Pokémon red, One Piece blue, Riftbound gold — are the system's DNA: the prismatic wordmark is built from exactly these three.
Typography
Gill Sans — display & body
The typeface of the Pokémon franchise itself — humanist, approachable, and editorial. Matches the brand DNA without imitation.
JetBrains Mono — price numerals
Numbers on a monospace baseline align cleanly in data-dense rows. Every price, delta, and spread figure uses mono.
Signature Elements
Prismatic foil wordmark
Red → Blue → Yellow gradient built from the three games' shared DNA. Animates on a slow pan — the same loop as a holographic card under light.
Holographic card sheen
Card art gets a subtle sheen on hover using mix-blend-mode: multiply in light mode, screen in dark — same visual arc, adapted per surface.
Light Mode
Pokédex Bright
Warm white base, Pokéball red accents. Clean editorial read for daytime browsing.
Dark Mode
Pokédex Night
Cool slate night, the three brand hues brightened. High contrast for after-hours price watching.
Colors cross-fade via a transient .theme-transition class (0.4s). Preference persists to localStorage; first visit respects prefers-color-scheme.
Trend Signal System
Every card wears one of six signals.
The nightly trend engine tags each card by its 7-day move. The system runs on three semantic tones — gain, loss, flat — so colour always reads as direction; the emoji carries intensity. One glance tells a collector whether a card is heating up, holding, or sliding.
≥ +20% · 7d move
The week's biggest movers — earns the FloorLeader spotlight on the homepage chart.
+5% to +20% · 7d move
Climbing steadily over the trailing window. Heating up, not yet spiking.
−5% to +5% · 7d move
Holding flat — no meaningful move in either direction this week.
−15% to −5% · 7d move
Softening. Worth watching before it slides into a full drop.
≤ −15% · 7d move
Sharp decline — a potential entry for buyers, a warning for holders.
No recent data
Too few price points in the window to compute a trustworthy trend.
Bands computed nightly by the npm run trendsjob from each card's 7- and 30-day price delta.
S7
Information Architecture
Four routes. Every user job fits one of them.
Deliberately minimal. The IA was constrained by the user's job: get a fast read on what's moving, browse the full catalog, understand a set as a sector, or deep-dive on a single card.
Home
/The Weekly Card Chart — editorial price guide, biggest movers
The Board
/browseFull catalog browser — gallery or index, filtered by game/set/kind
Sets
/setsMarket sector view — average move, hot/cold card count, top value
Card Detail
/card/[id]Deep dive — price history, Market Depth panel, watch/alert
S8
Process & Iteration
The first homepage looked like every other market dashboard.
V1 led with a live ticker and a wall of panels — top gainers, top losers, market cap, a real-time chart, a watchlist. It looked data-rich, but it implied real-time data the $0 pipeline never had, and gave the eye no place to land.
The redesign threw out the dashboard metaphor entirely. A dated masthead reframes the page as a weekly price guide; one FloorLeader card gets the spotlight; the rest of the movers live in a scannable table. Same data — a point of view.
Five panels competing for attention and a ticker promising live data we didn't have. Indistinguishable from any crypto dashboard — no editorial voice.
A dated masthead sets the promise — curated, weekly, not real-time. One FloorLeader gets the spotlight; movers sit in a table built for scanning a column of numbers.
What Changed & Why
Stopped pretending to stream real-time data the free pipeline never had. A dateline makes “curated” the feature, not a shortcoming.
Gave the eye a single entry point — the week's biggest mover — then a clean column of numbers to scan.
Traded a templated look for a point of view. The homepage now tells a collector what to pay attention to.
S9
Pages & Key UX Decisions
Every decision has a reason that lived in the data.
/Home
—The Weekly Card Chart
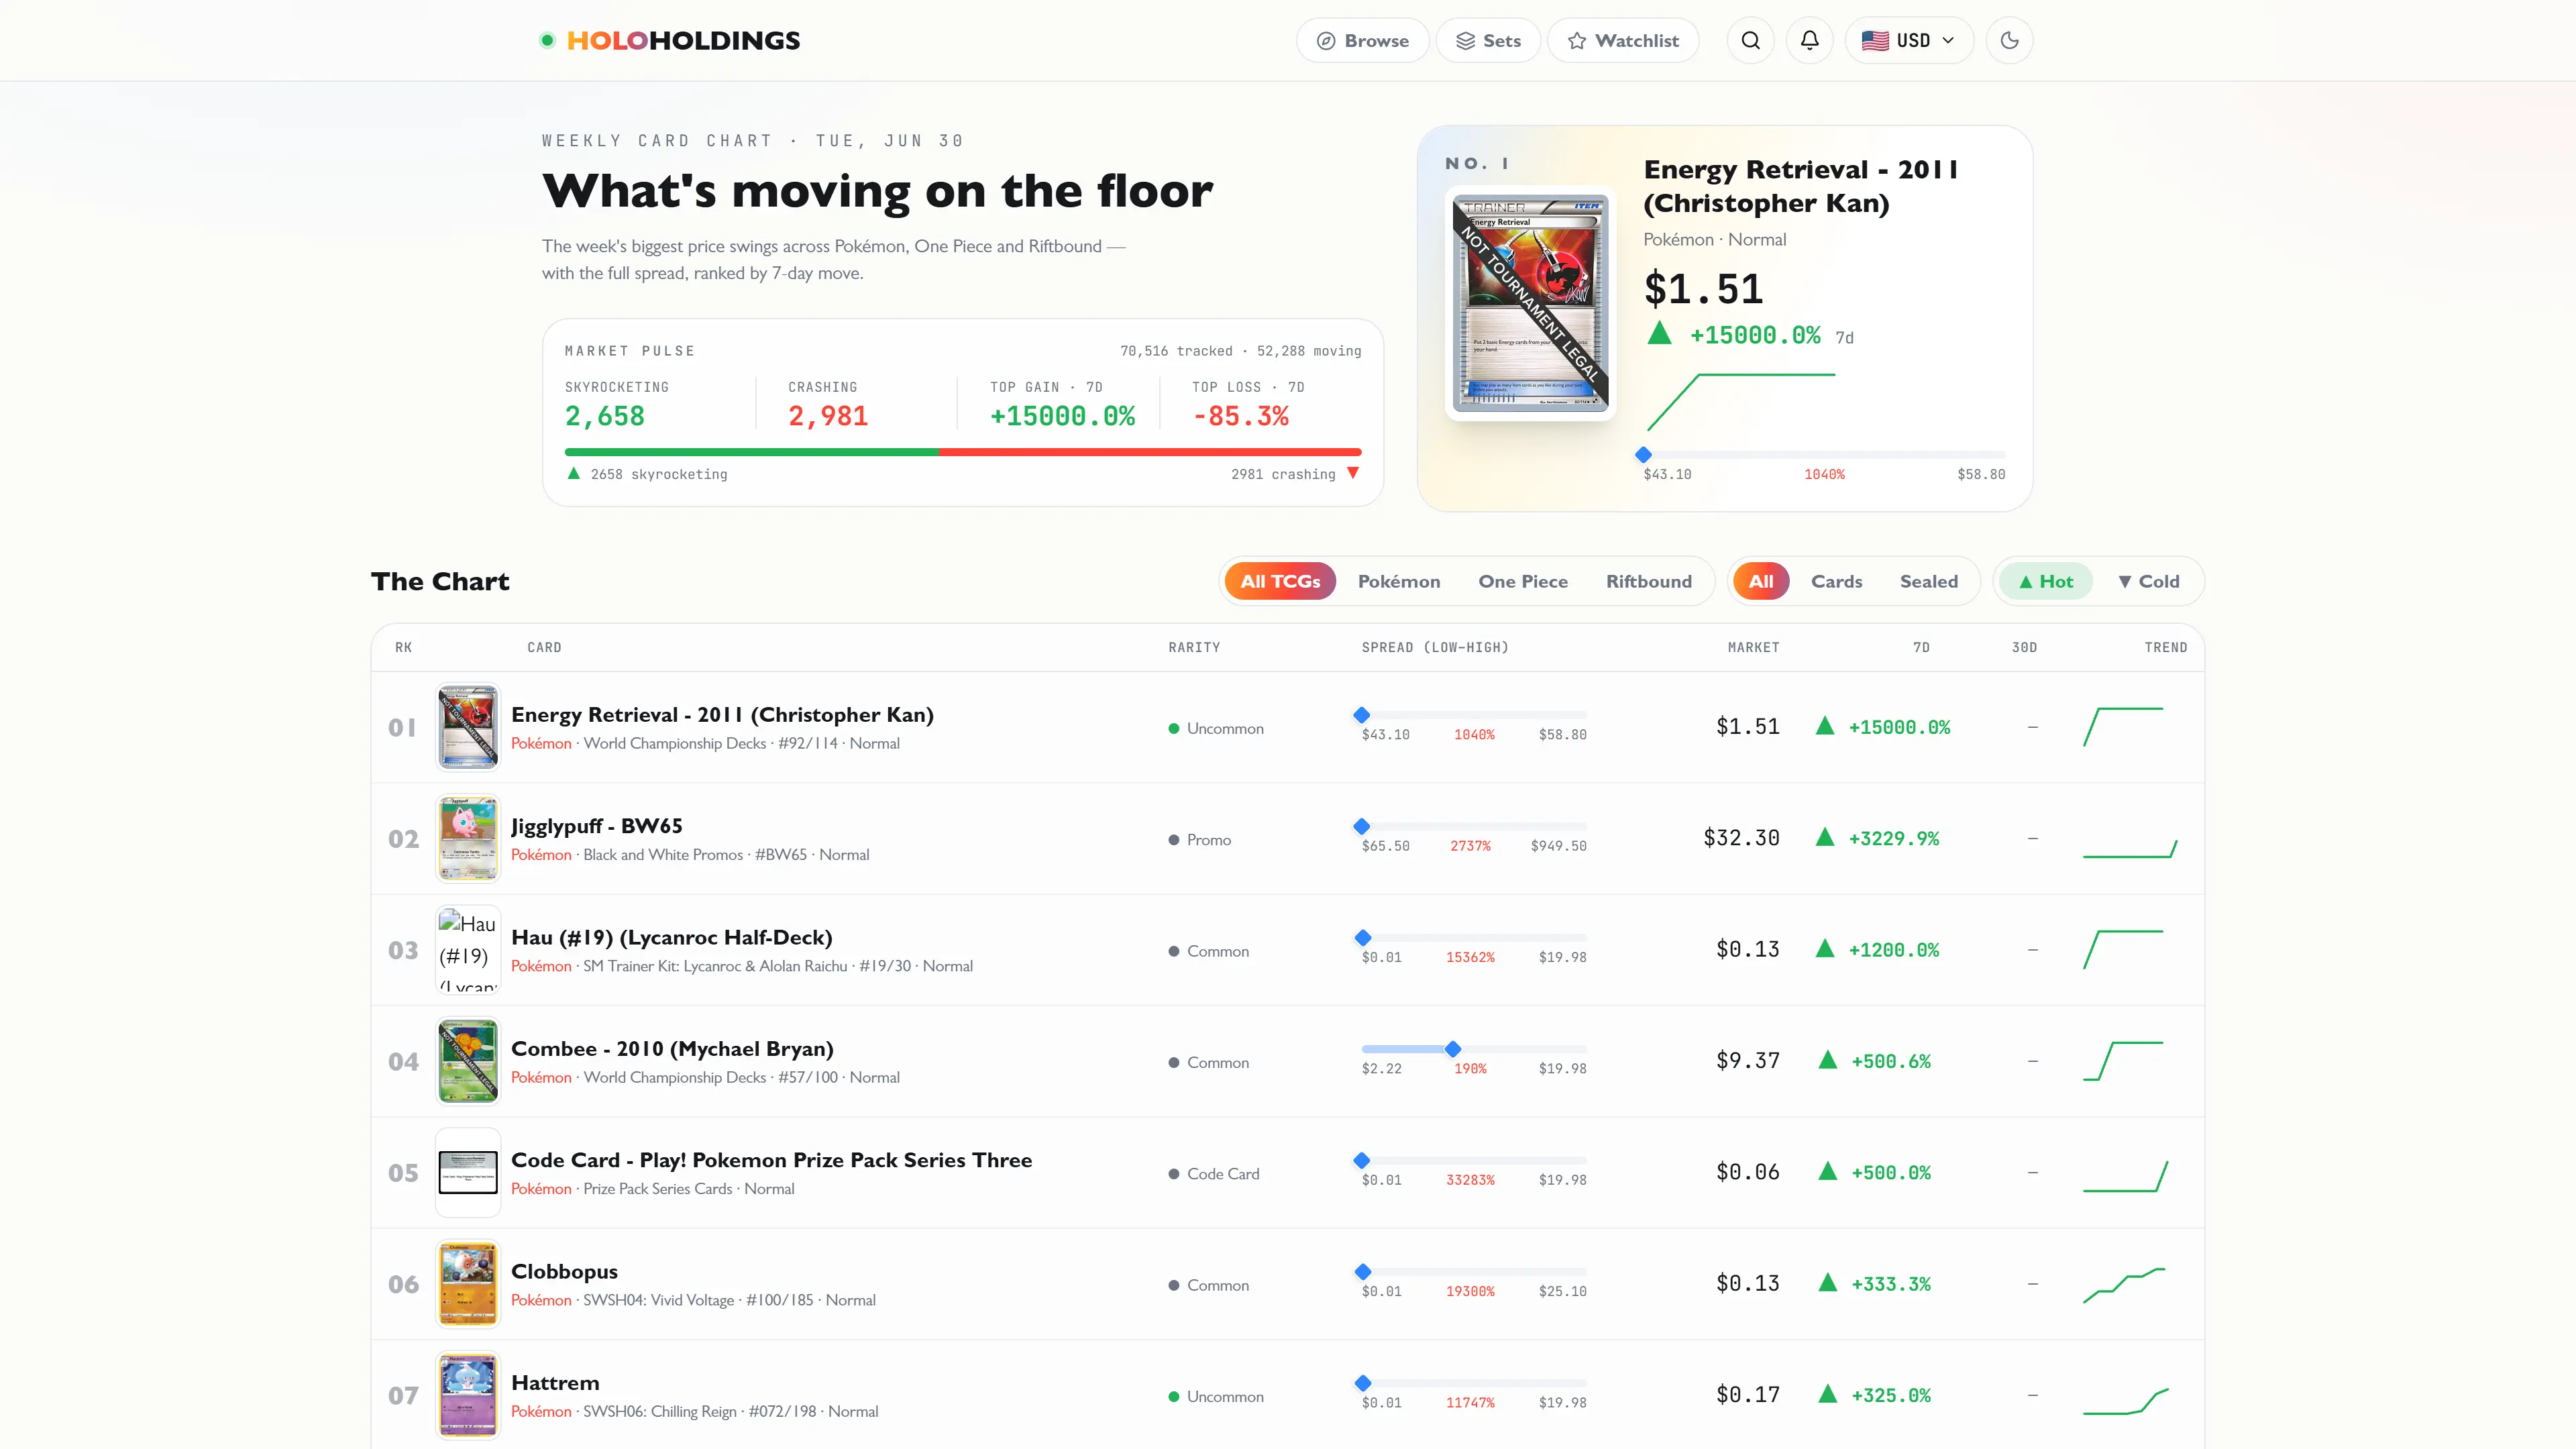
Editorial over live
The initial ticker + panels layout was scrapped — it looked like every other market dashboard. The redesign reframes the homepage as an editorial price guide. The masthead dateline sets expectations: it's curated, not real-time.
Table over cards
Cards look great for browsing art. But the home page is about comparison — which card moved more, how does its spread compare to the next. Tables let the eye scan a column of numbers. Collectors who watch prices think in rows.
FloorLeader spotlight
The single biggest mover of the week gets a featured card position at the top — oversized art, foil sheen animation, price delta called out prominently. One card per week gets the spotlight.
/browseBrowse
—The Board
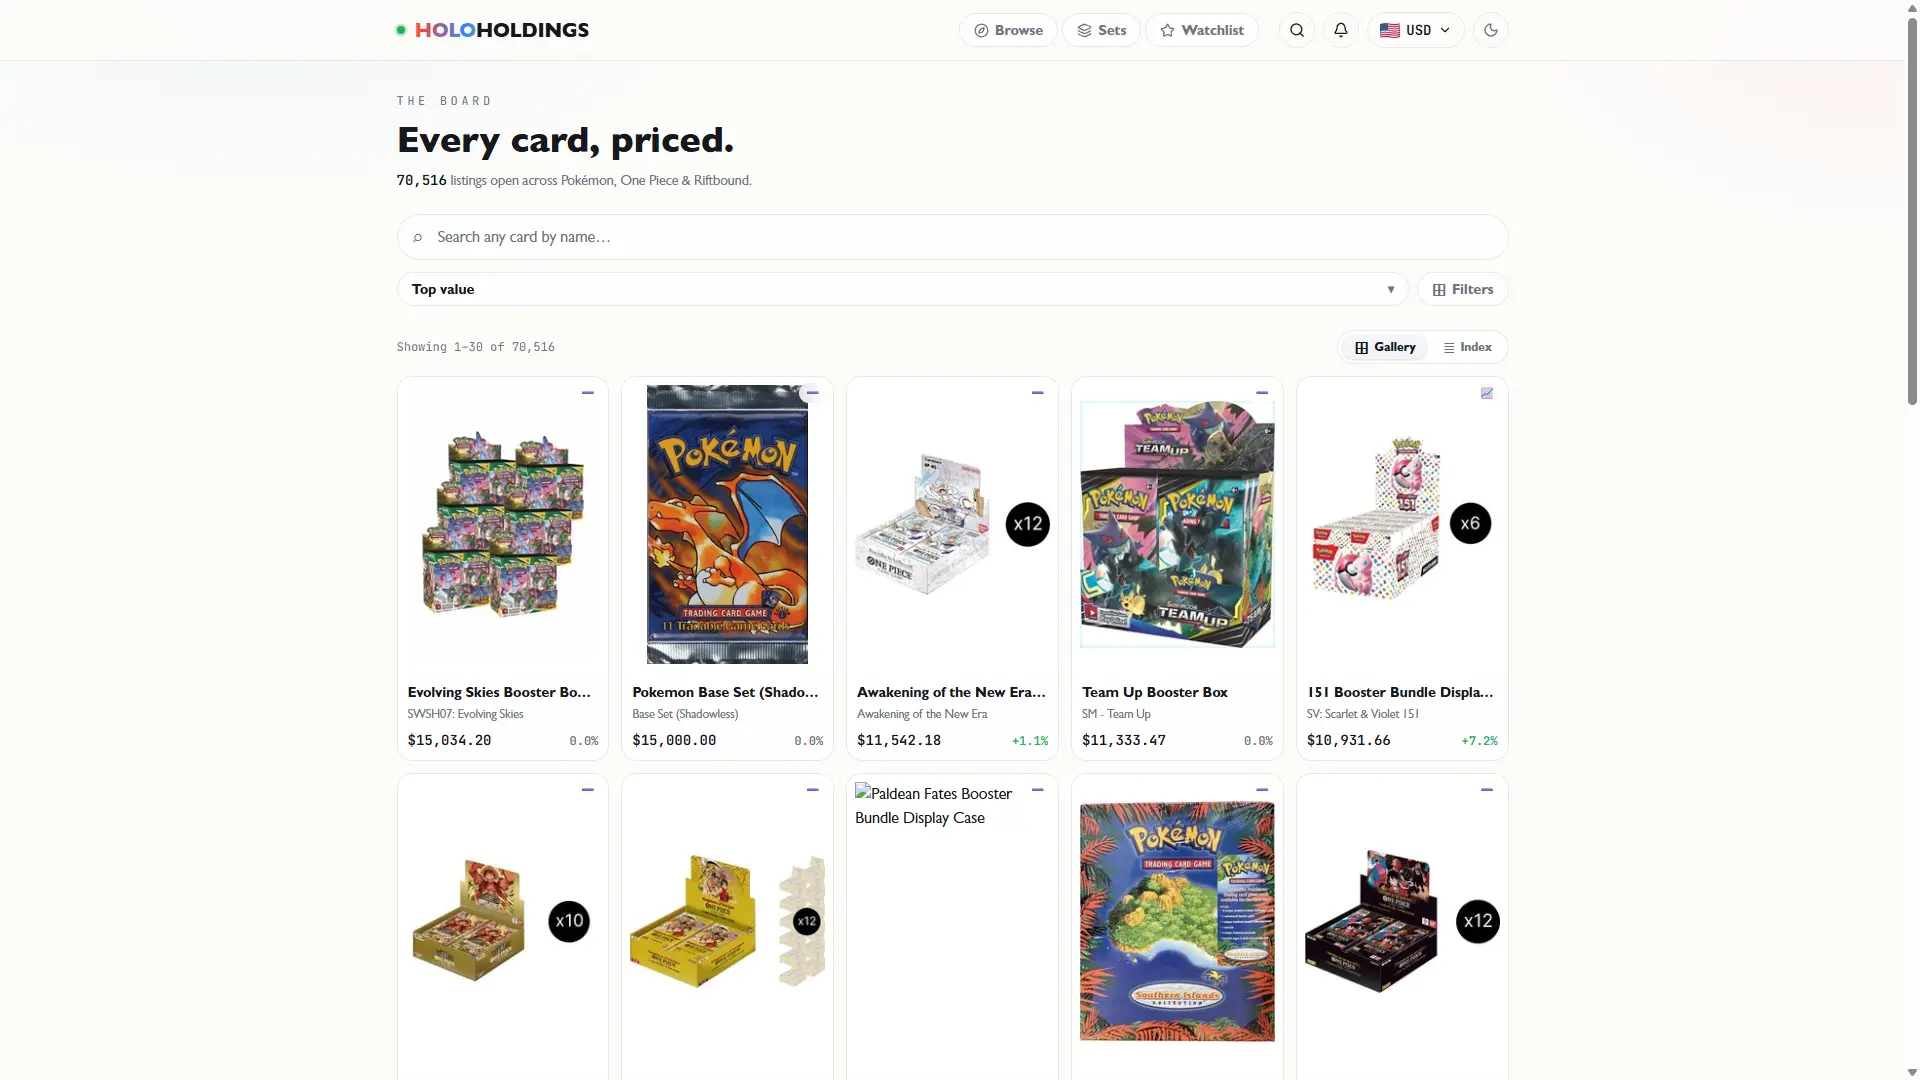
Gallery ⇄ Index toggle
Two distinct modes for two distinct user types. Gallery for the collector who thinks visually. Index for the analyst who wants to screen by percentage move. View preference persists in the URL so deep links preserve the mode.
Singles vs. Sealed
TCGCSV data mixes individual cards and sealed products (booster boxes, ETBs, deck sets). Singles have a card number and/or rarity; sealed products have neither. This binary is computed at query time — no separate data source needed.
Debounced filter system
Search pushes to the URL at 350ms, no form submit. Game pills, set dropdown (scoped to the selected game), kind toggle, and sort all preserve their state in pageHref for pagination.
/setsSets
—Sector View
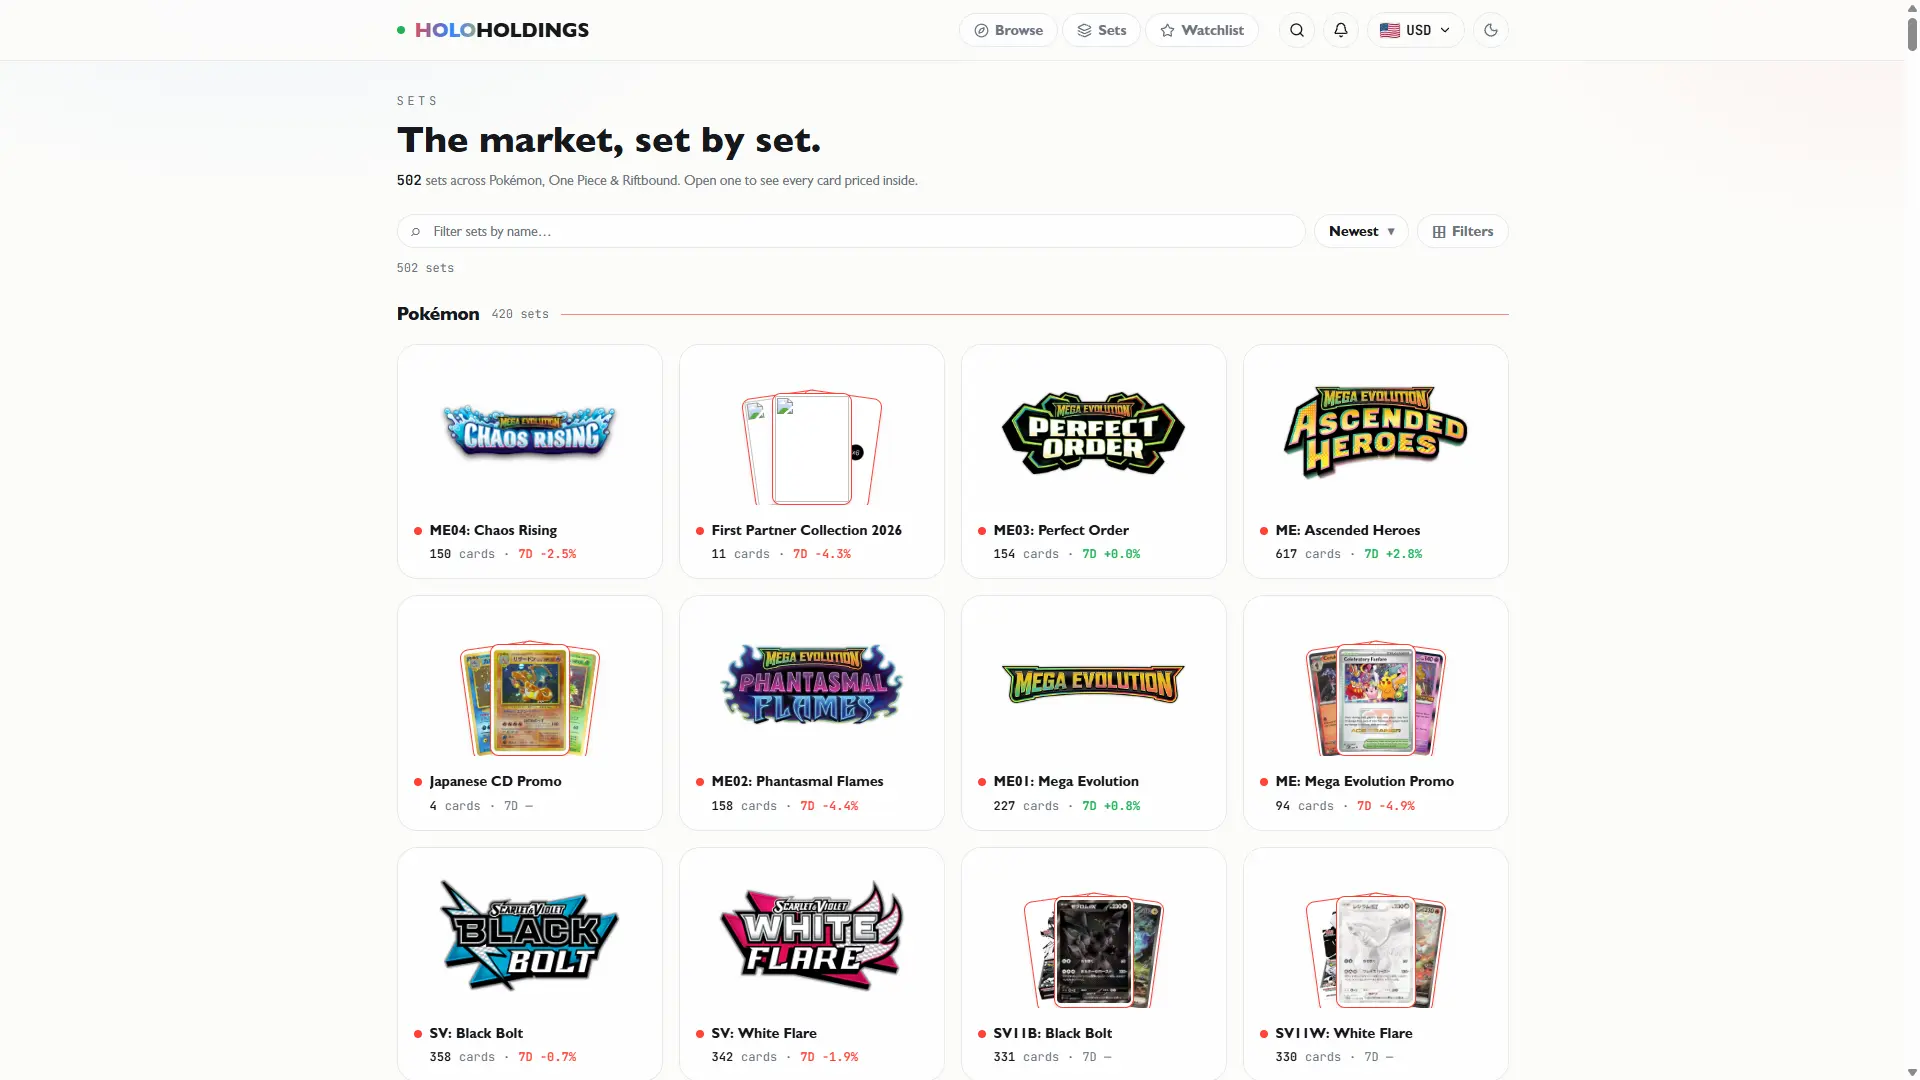
Sets as market sectors
"Scarlet & Violet" isn't just a set — it's a sector of the Pokémon market with its own average 7-day move, hot/cold card count, and top value. Framing sets as sectors gives collectors a portfolio-level read.
Booster-fan in pure CSS
Each tile fans its top 3 cards by value on group-hover. Pure rotate() transforms on siblings — no JavaScript needed. motion-reduce kills the spread cleanly.
Set logos, zero API calls
Official set logos are sourced from the pokemontcg.io static CDN. A pre-computed map is committed to the repo so the live site needs no network request to resolve a logo URL at runtime.
/card/[id]Card Detail
—Deep Dive
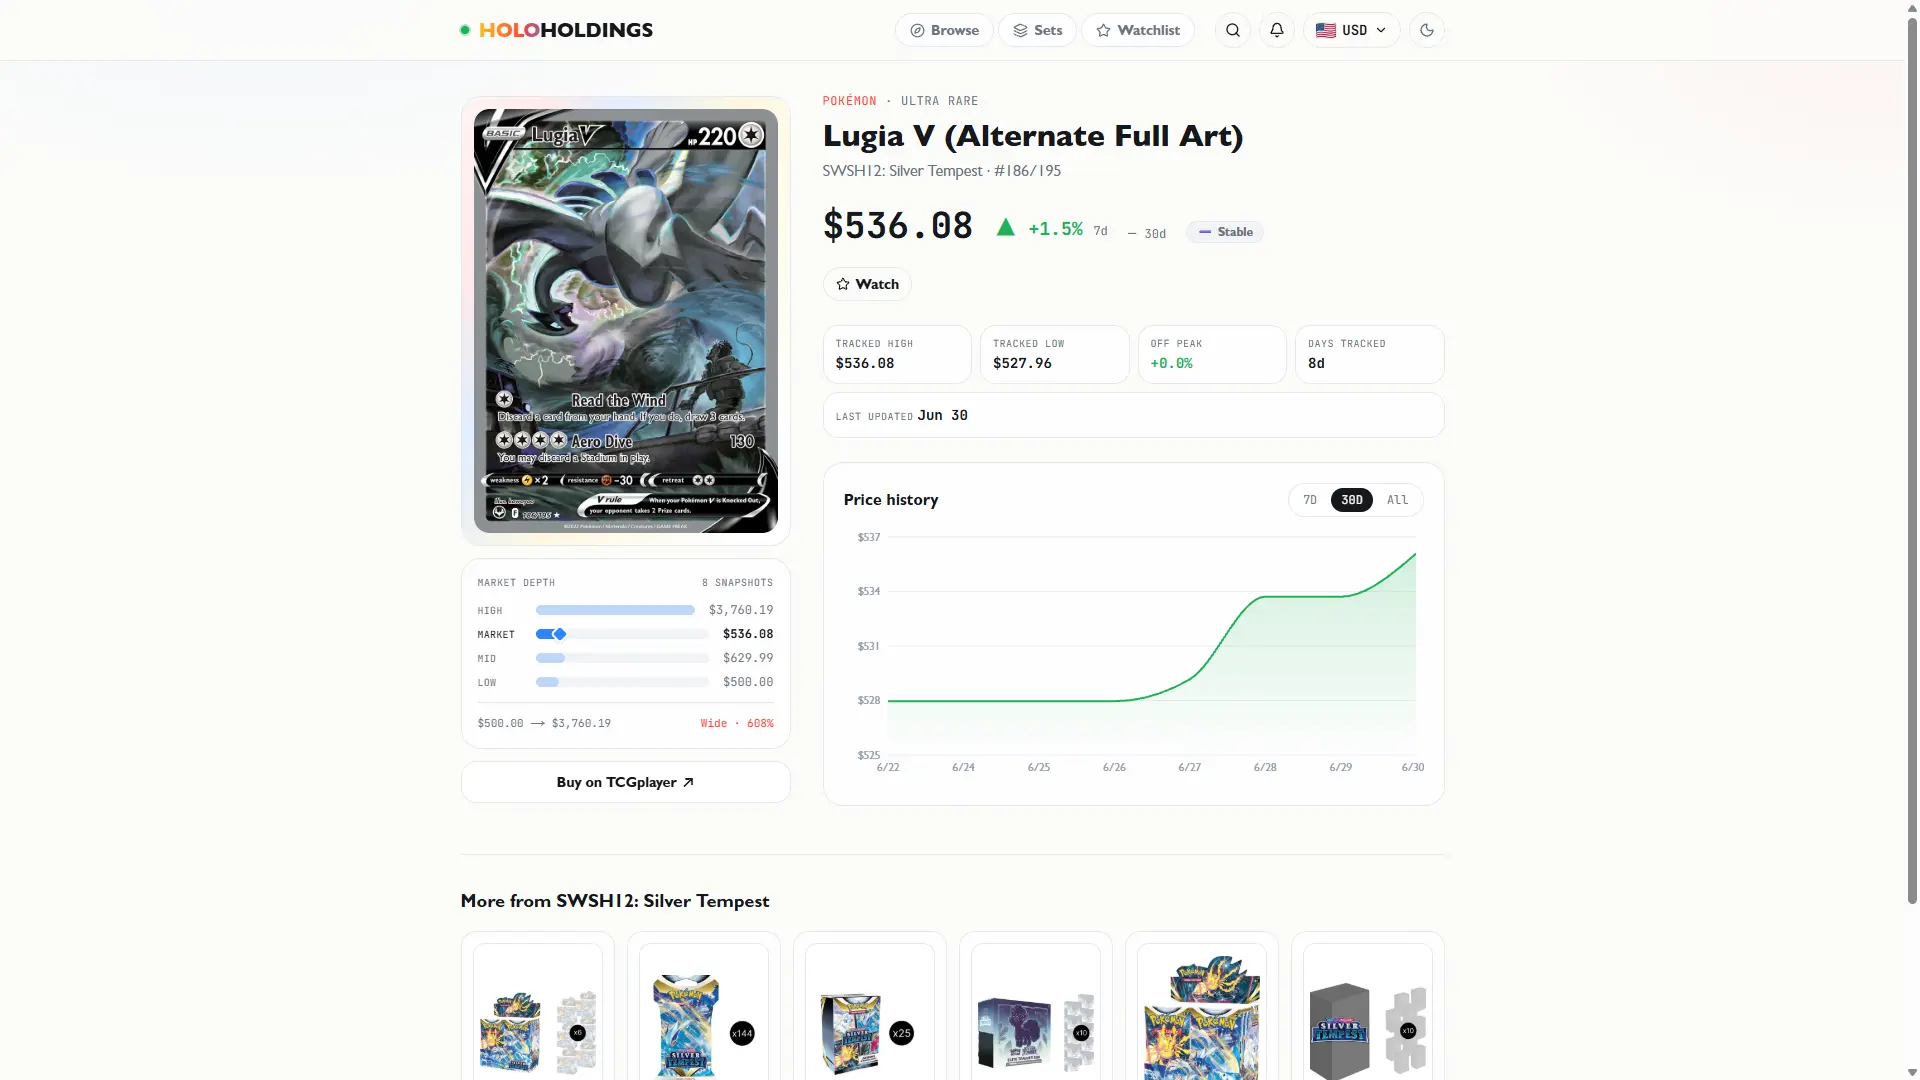
Sticky 2-column layout
Left column (330px fixed) = art + market data + buy CTA. Right column = price data + chart + related cards. The left column sticks while scrolling the right — card art always stays visible as you read through the data.
Sub-type tabs open on longest history
Pokémon printings come in Normal, Holofoil, and Reverse Holofoil — each with its own price history. The default tab opens on the printing with the longest history, not just [0], so the chart is never empty.
Market Depth panel
An order-book ladder showing High / Market / Mid / Low price rungs. Bar widths scale relative to the ceiling. The Market rung gets a rotated-diamond marker — a signature element that carries through from the spread bar.
Dynamic chart Y-axis
Y-axis width computed dynamically from the widest tick label (~6.5px/char, floor 44px). Long currency labels like CA$3,962 don't get clipped at any viewport. Empty state shows honestly when fewer than 2 data points exist.
S10
Card Anatomy
The card detail page turns one price into a full read.
A single “market price” hides more than it tells. Two signature components on every card page give that number context — where it sits in the spread, and where it's been.
Market depth
28 snapshotsMarket Depth — the spread at a glance
An order-book ladder: High, Market, Mid, and Low rungs with bar widths scaled to the ceiling. The Market rung carries a rotated-diamond marker so the eye lands on it first. No math — the spread is the shape.
Price History
▲ +49.2% · 90dPrice History — context over time
Sub-type tabs — Normal, Holofoil, Reverse Holo — each carry their own history; the chart opens on the printing with the longest record so it's never empty. The Y-axis width is computed from the widest label, so long currency values never clip.
S11
Data Layer
Six free APIs. Zero paid infrastructure. Built to run forever.
The ingestion pipeline, HD image enrichment, set logo generation, and release date mapping all run as offline scripts with local disk caching — so re-runs cost zero network. No paid APIs, end to end.
Source
Use
Cost
TCGCSV
Daily price dumps — all TCGplayer cards + metadata for all 3 games
Freepokemontcg.io
HD card images + set logos for Pokémon
Freeoptcgapi.com
HD card images for One Piece
Freeopen.er-api.com
Live currency exchange rates
Freeflagcdn.com
Country flag images for the currency selector
FreeTCGplayer
External buy link destination (product ID → URL)
FreeIngestion Pipeline — GitHub Actions cron · 06:00 UTC daily
npm run ingestFetches today's TCGCSV price dump for all 3 games, upserts card metadata, appends daily price rows. Idempotent — running twice on the same day is safe.
npm run trendsSQL upsert into card_trends computing 7-day and 30-day deltas. Tags by band: Skyrocketing ≥+20%, Trending Up ≥+5%, Stable, Trending Down >−15%, Crashing ≤−15%, Neutral.
npm run alertsSingle atomic CTE — find all watch targets where market_price ≤ target_price, flip the flag, write a notification row. Idempotent. Re-arms only when the user re-watches the card.
Database Schema — 5 tables · Neon Postgres
cardsStatic metadata — name, set, rarity, game, image URLs
pricesDaily time-series — market / low / mid / high per card × sub-type. Only table that grows.
card_trendsComputed deltas + tags. Updated nightly, not appended. (card_id, sub_type) PK.
wishlistsUser-set price targets per card × sub-type
notificationsAlert events — fired when market ≤ target
S12
Scale
40,430
Cards tracked across Pokémon, One Piece, and Riftbound
299
Sets browsable with logos and release dates
~40k
New price rows appended every day
6
Currencies with live exchange rates — USD, CAD, EUR, GBP, AUD, JPY
HD Image Coverage
Pokémon
81.7%
22,545 / 27,584 cards matched
pokemontcg.io
One Piece
87%
5,622 / 7,055 cards matched
optcgapi.com
Riftbound
—
0 / 1,246 cards matched
Falls back to TCGplayer size-upgraded URL
S13
Outcomes
What Shipped
Shipped end-to-end in ~4 weeks, solo
Zero ongoing infrastructure cost
40,430 cards across 3 TCGs, updated daily
299 sets browsable with logos + release dates
6-currency display with live rates
Full wishlist + price alert pipeline
Deployed on Vercel with GitHub Actions automation
Field Validation
Tested live · 3 card shows · 2 audiencesThe research started on the trade floor, so validation went back there. I put the live app in the hands of the two audiences it was built for — vendors working their tables and hobbyist buyers walking the show — and sent it to more of the Lower Mainland TCG community to test at their own pace. The two personas from the start of this study reappeared as the two tester groups.
“In a fast, high-intensity environment, every sale matters. Being able to pull a card's current value — and see whether it's rising or falling — is a key reason to buy, sell, or decline a sale.”
“I did a couple of laps around the show and kept spotting it — cards priced well below where they're heading, which is a great buy, and cards priced high that are already falling.”
What the majority reported
Navigated the app without instruction
Found the card they were after instantly
Bought with confidence in the card's value
Saw it as a way to grow their collection
What I'd Do Differently / Future Scope
From Testing
Native mobile app
The single most-requested change from testers. A card show is a phone-in-hand environment — a native app would make it faster to reach mid-deal than loading the site in a mobile browser.
From Testing
Load performance
The $0 constraint has a cost: free-tier hosting and unpaid API cold-starts leave some pages loading slower than they should. Caching, image optimization, and edge rendering are the first levers before any paid tier.
Auth
v1 is intentionally single-user. Adding Clerk or Auth.js would enable multi-user wishlists without schema changes — a user_id column is already anticipated.
Graded card prices
PSA/BGS pricing isn't on the free tier. Would require PriceCharting's paid API or a scraping layer — both out of scope for $0.
Price retention job
A rolling 120-day window on the prices table to stay within Neon's 0.5 GB free-tier limit. Not yet built; the table will eventually need pruning.
More games
Any game on TCGplayer can be added by adding its category ID to the ingestion client. The architecture is designed for this.
Next Project
EDR Digitalization · Code for Canada × RCMP→